
Debugging React Native data flow can be challenging, but it's crucial for maintaining app performance and user satisfaction. Data flow issues like state mismanagement and unnecessary re-renders are common sources of bugs in complex apps. Here’s what you need to know:
- Common Problems: Stale props, infinite render loops, and direct state mutations can cause outdated UIs or sluggish performance.
- Key Tools: React Native DevTools (for Hermes-based apps), Flipper (for native debugging), and Reactotron (for real-time state monitoring) are essential for identifying and fixing bugs.
-
Techniques: Use logging (
console.log), set breakpoints, and wrap risky components in error boundaries to catch and resolve issues faster. - Testing: End-to-end tools like Maestro validate data flows by simulating user journeys, ensuring everything works as expected.
Pro Tip: Combining effective debugging tools with a solid testing strategy helps catch issues early and keeps your app running smoothly. Address data flow issues early and consistently.
React Native Debugging: From JS to Native
sbb-itb-e343f3a
React Native Data Flow Architecture Explained
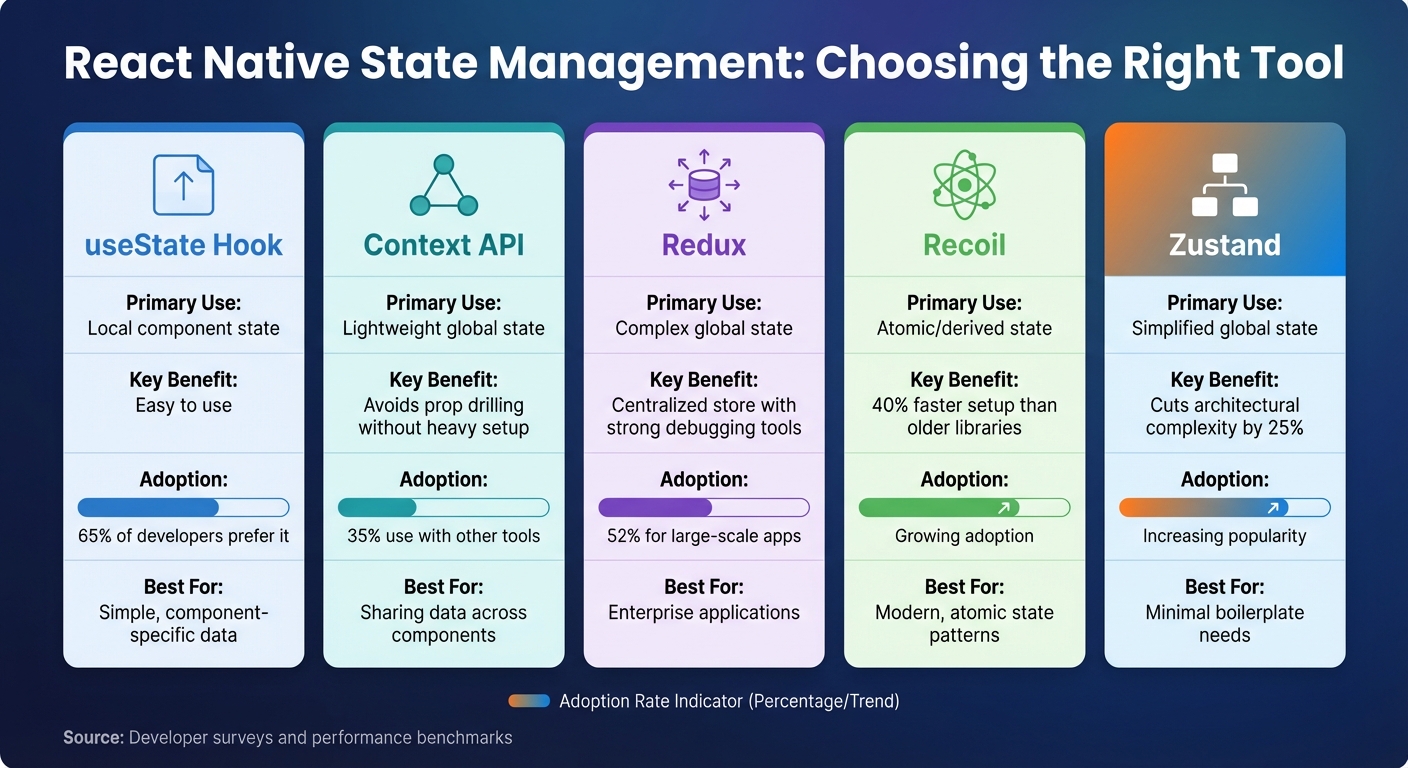
React Native State Management Tools Comparison Chart
Getting a handle on React Native's data flow is crucial for debugging effectively. React Native relies on a unidirectional data flow, where information moves from parent components to child components through props. When the state changes, it triggers updates to the UI. This predictable flow makes it easier to identify and fix bugs - when you know how data is supposed to move, it’s much simpler to figure out where it’s getting stuck.
Core Components of Data Flow
React Native provides several tools to manage data, each suited to different needs. For instance, local state managed with the useState hook works great for handling data specific to a single component. It is widely preferred for straightforward tasks . When you need to share data between components, props are the go-to solution for parent-to-child communication. However, too much reliance on props can lead to "prop drilling", where intermediary components have to pass data they don’t use, making the code harder to maintain.
For avoiding excessive prop drilling, the Context API offers a lightweight way to share data across multiple components. Developers often pair it with other tools . As applications grow in complexity, Redux often becomes the tool of choice. It centralizes data in a single, immutable store, ensuring a predictable flow . Meanwhile, modern libraries like Zustand and Recoil are gaining traction. Zustand simplifies architecture by their minimal APIs, while Recoil offers atom-based architecture for derived state .
| State Management Tool | Primary Use Case | Key Benefit | |
|---|---|---|---|
| useState Hook | Local component state | Simple, built-in, ideal for component-level state | |
| Context API | Lightweight global state | Avoids prop drilling without heavy setup | |
| Redux | Complex global state | Centralized store with strong debugging tools | |
| Recoil | Atomic/derived state | Minimal boilerplate with atom-based architecture | |
| Zustand | Simplified global state | Lightweight with simple API and less boilerplate |
Once you’ve chosen the right tools, understanding common data flow issues becomes the next priority.
Common Data Flow Problems
Even with these tools, data flow doesn’t always go as planned. One common issue is stale props, where the UI shows outdated data because state updates didn’t propagate correctly. Another frequent headache is unnecessary re-renders, which occur when components refresh even though their data hasn’t changed. This can drag down performance.
Missteps in configuring useEffect can also lead to problems like infinite render loops or unintended side effects. Another pitfall is directly mutating state instead of creating new, immutable copies. This often results in unpredictable UI behavior. Asynchronous operations, like fetching data, add another layer of complexity. If you don’t clean up properly, you might end up with updates on unmounted components, leading to memory leaks.
These challenges aren’t rare. In fact, state mismanagement is one of the primary sources of bugs in complex apps , and a major pain point for developers . Spotting these problems is the first step toward applying effective debugging strategies, which we’ll explore in later sections.
Debugging Tools for React Native
Once you understand common data flow challenges, the next step is finding the right tools to identify and fix them. React Native provides multiple debugging options, each tailored for specific needs. With the release of React Native 0.76, React Native DevTools became the go-to debugging solution for Hermes-based apps. This built-in tool consolidates various features into one interface, including tabs for Console, Sources (to set breakpoints), Network (Expo only), Components, and Profiler. If you're using Expo CLI, you can open DevTools by pressing 'j'.
React Native Debugger
The React Native Debugger is a standalone desktop application that combines React DevTools and Redux DevTools. It's especially helpful for projects using Redux, as it offers features like time-travel debugging and an action log to track state changes . However, since it relies on the deprecated "Remote JS debugging" (phased out starting with React Native 0.73), it’s not suitable for Hermes-based projects. For modern setups, React Native DevTools is the better choice. That said, if you're working on older codebases or need Redux-specific tools, this debugger still has its place. To install, use:
npm install -g react-native-debugger
It connects via port 8081 . Redux DevTools significantly improves debugging efficiency by enabling time-travel debugging and detailed action logging .
If you need to debug beyond React and Redux, tools for inspecting native modules and layouts are worth exploring.
Flipper for Advanced Debugging
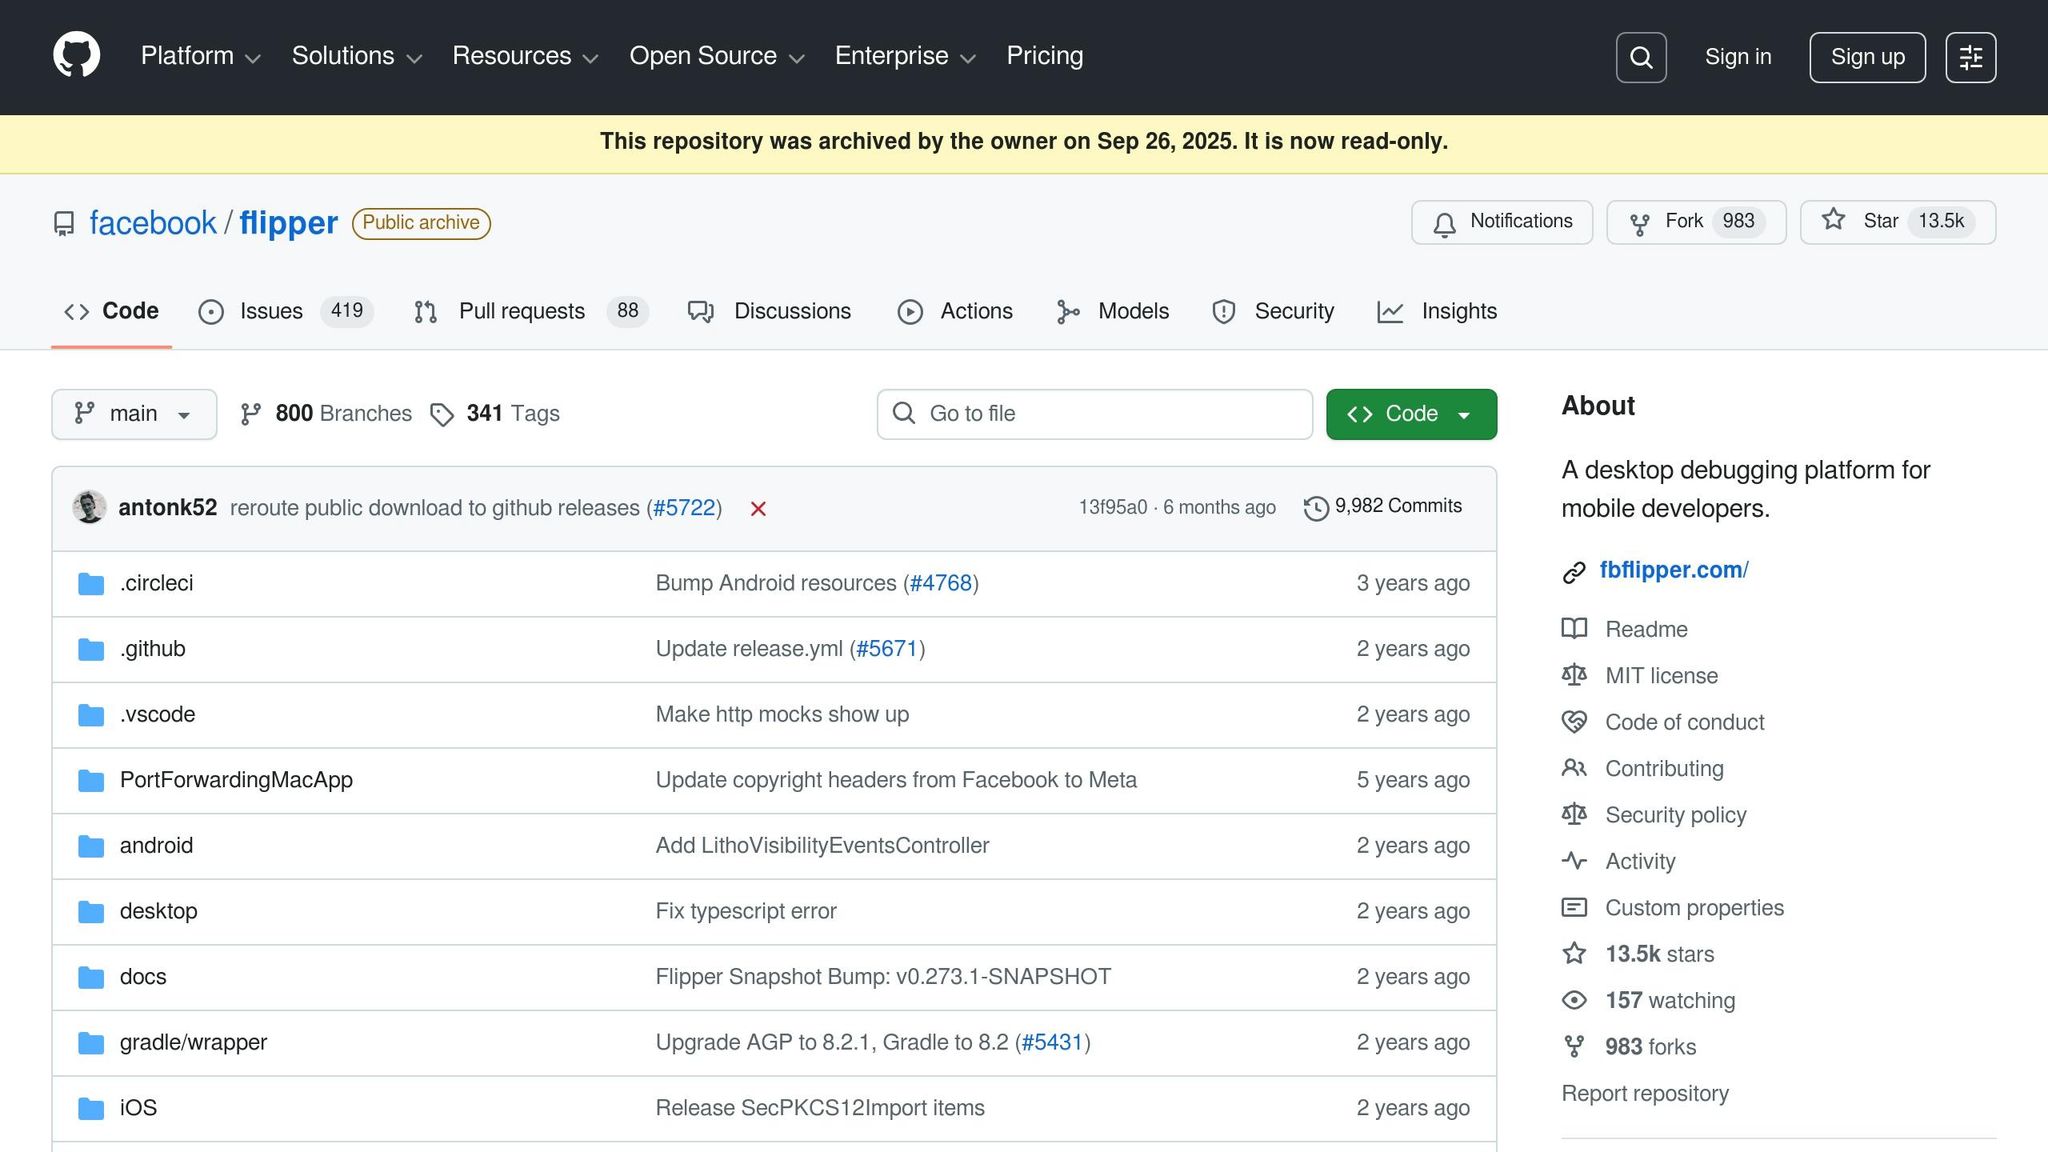
Flipper has shifted its focus over time. While React Native DevTools now handles React-specific debugging, Flipper excels at inspecting native modules, layouts, and platform-level performance. It also supports plugins for monitoring network requests and state management. If your project involves native code or layout inspections, Flipper is a valuable option. However, for React-level tasks like checking props and state, stick with React Native DevTools.
For real-time monitoring of data flow and state updates, tools like Reactotron and LogBox come into play.
Reactotron and LogBox for Real-Time Monitoring
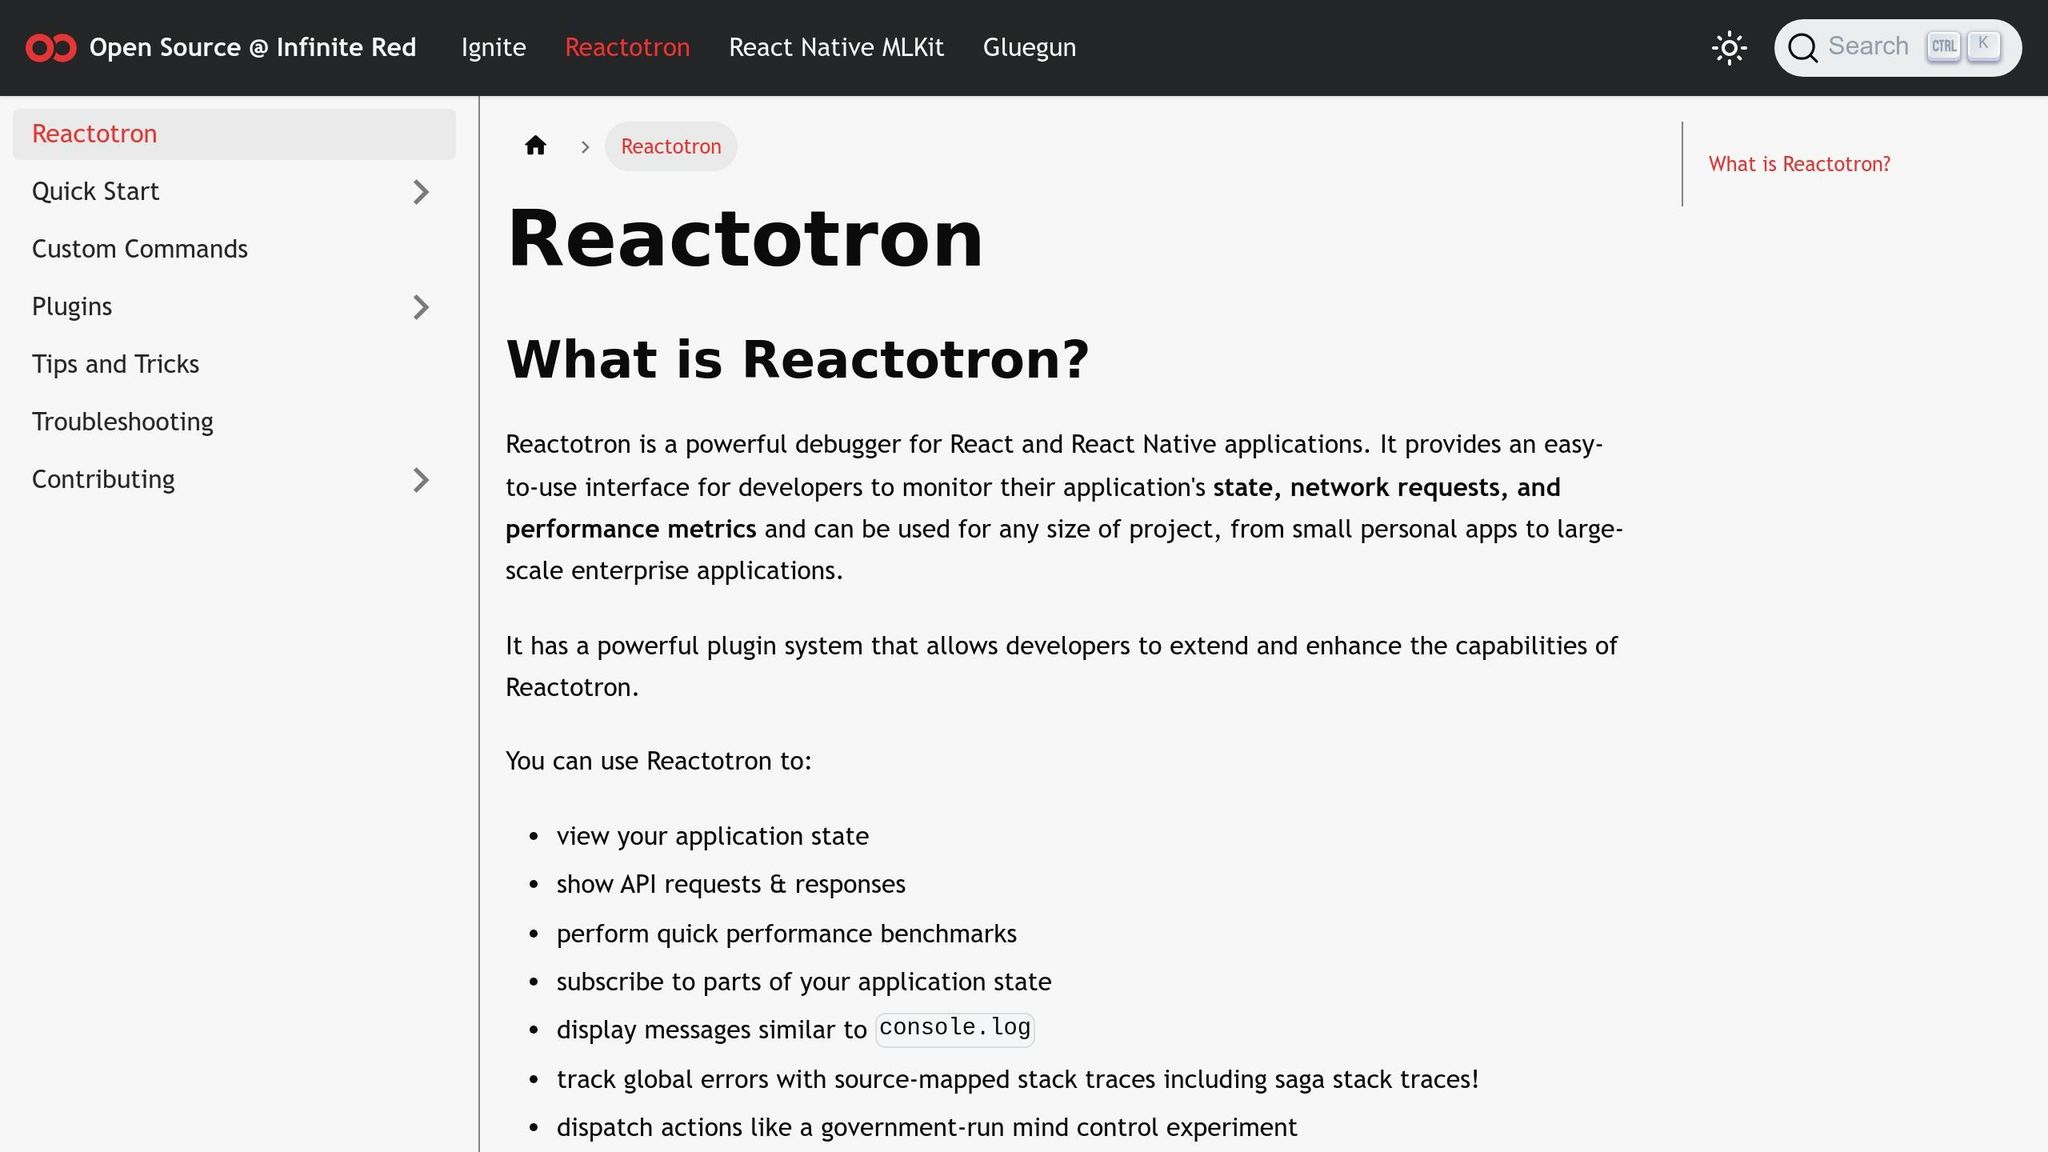
Reactotron is a desktop app designed for real-time monitoring. It tracks state changes, logs API requests, and allows you to use console.tron.log() for viewing live updates of component states and props . This makes it an excellent choice for keeping tabs on state changes as they happen.
LogBox, built directly into React Native, shows warnings and errors as they occur. You can clean up noisy logs by using LogBox.ignoreLogs(['pattern']), ensuring a clutter-free development environment. While LogBox provides instant on-screen feedback, the DevTools Console offers a more detailed log history. These tools make it easier to catch and address data flow issues in real-time, preventing them from slipping through to later stages.
| Tool | Primary Use Case | Key Data Flow Feature |
|---|---|---|
| React Native DevTools | General React debugging | Integrated Console, Sources, Components, and Profiler |
| React Native Debugger | Redux/State management | Time-travel debugging and Action Log |
| Reactotron | Real-time monitoring | console.tron for state snapshots |
| Flipper | Native/Performance | Native module and layout inspection |
| LogBox | Error/Warning visibility | In-app error and warning notifications |
Debugging Techniques and Strategies
Using tools like React Native DevTools alongside other real-time monitoring options can greatly simplify the debugging process. These techniques are especially helpful for unraveling complex data flow issues. In fact, efficient debugging practices can cut down bug-fixing time by half, making them a must-have for developers .
Logging and Tracing Data Flow
Strategic logging is one of the simplest yet most effective ways to track data flow. By placing console.log() statements in state update functions and useEffect hooks, you can pinpoint unnecessary re-renders, which often signal inefficient data handling or excessive prop-drilling. For better clarity when dealing with complex objects, tools like JSON.stringify(state, null, 2) or console.table() can make logs much easier to read.
Good logging practices include capturing state transitions - tracking the previous state, the action taken, and the resulting new state. Tools such as Redux Logger or Reactotron can make this process even faster and more efficient .
For a deeper understanding of your code’s behavior, breakpoints can complement logging by allowing live inspections of your app’s state and execution flow.
Setting and Using Breakpoints
Breakpoints are a powerful tool for isolating issues and enabling developers to diagnose problems more efficiently . In React Native DevTools (introduced in version 0.76), you can set breakpoints by clicking line numbers in the "Sources" tab or by adding the debugger; statement directly into your code. When execution pauses, you can inspect variables, examine functions, and analyze the current state.
The Console tab in DevTools provides an interactive environment where you can test code snippets, invoke methods, or modify variables in real time. This seamless integration of tools makes breakpoint usage an efficient way to debug.
While breakpoints help with live debugging, error boundaries protect your application from runtime crashes.
Error Boundaries for Catching Data Issues
Error boundaries are specialized React components that catch runtime errors in their child components, log them, and display fallback UI elements instead of letting the app crash. They rely on two lifecycle methods: static getDerivedStateFromError() and componentDidCatch().
-
static getDerivedStateFromError()updates the component’s state to render a fallback UI when an error occurs. -
componentDidCatch()logs error details and the component stack trace, which can be sent to monitoring tools like Sentry or LogRocket.
By wrapping high-risk components - such as forms or data-heavy lists - in error boundaries, you can isolate failures and keep the rest of the app functional. This is crucial because up to 70% of users may abandon an app after encountering a single unhandled error .
Incorporating error reporting within componentDidCatch() provides valuable insights into production issues. Addressing the top 20% of recurring errors can resolve 80% of user complaints. Additionally, the "Pause on caught exceptions" feature in React Native DevTools can help debug even handled errors.
| Method | Purpose | Usage in Error Boundary |
|---|---|---|
static getDerivedStateFromError(error) |
Updates state to trigger fallback UI | Sets hasError: true to render fallback components |
componentDidCatch(error, info) |
Logs errors and side effects | Sends error and stack trace to monitoring services |
render() |
Defines UI behavior | Displays fallback UI if an error exists; otherwise, renders child components |
Testing Data Flows with Maestro
Breakpoints and error boundaries are great for catching issues while you're developing, but end-to-end testing is what ensures your entire React Native app’s data flows work as expected in real-world use. That’s where Maestro steps in, offering a straightforward way to test user data flows without the usual headaches that come with traditional testing frameworks.
Maestro works at the accessibility layer, testing the actual bundled app - no modifications needed. This means it validates data flows from the perspective of the end user, making it a perfect complement to earlier debugging methods. It uses a clean, declarative YAML syntax that lays out user journeys step by step, making it easy for developers and even non-technical team members to understand and use.
One of Maestro’s standout features is its automatic handling of network responses, state updates, and UI re-renders. No need to fiddle with explicit timeouts - it waits for these events automatically. This makes it especially helpful when testing complex data flows.
Creating Data Flow Tests with Maestro Flows
Maestro Flows take these concepts further, letting you simulate and verify entire user journeys. Essentially, a Maestro Flow is a YAML file that replicates how a user interacts with your app, ensuring data shows up correctly in the UI. Here’s an example for a shopping cart flow in a React Native e-commerce app:
appId: com.mystore.app
---
- launchApp
- tapOn:
    id: "product-list-tab"
- tapOn:
    id: "add-to-cart-btn-1"
- assertVisible: "Item added to cart"
- tapOn:
    id: "cart-icon"
- assertVisible:
    id: "cart-item-count"
    text: "1"
- assertVisible: "$29.99"
- tapOn:
    id: "checkout-btn"
- inputText: "John Doe"
- tapOn:
    id: "place-order-btn"
- assertVisible: "Order confirmed"
This flow checks every step, from adding an item to the cart to confirming an order. The testID property in your React Native components links directly to the id in Maestro, providing stable selectors that won’t break if the UI text changes.
Maestro also supports features like environment variables, JavaScript snippets through evalScript, and reusable sub-flows (like login.yaml) to simplify more complex testing scenarios.
"The framework allows you to define and test Flows, which are parts of the user journey in your app... With Maestro's integration into Ignite, developers can now write and maintain e2e tests more efficiently." - Ashish Kharche, Mobile Developer
For added convenience, Maestro Studio lets you visually inspect your app's UI tree and auto-generate YAML commands, so you don’t need to write them manually. Plus, the maestro test --continuous flag automatically reruns tests whenever you save changes, giving you a fast feedback loop similar to Jest's watch mode.
Testing Across Android and iOS with Maestro
Consistency across platforms is key, and Maestro shines here with its cross-platform testing capabilities. A single YAML test suite can run on both Android and iOS, ensuring your app’s data flows work seamlessly on both platforms. This is especially important because about 10% of the React Native testing pyramid should focus on end-to-end tests.
For platform-specific differences, Maestro offers conditional logic using the when parameter. For example:
- tapOn:
    id: "submit-btn"
- when:
    platform: iOS
  tapOn: "Allow"
- when:
    platform: Android
  tapOn: "ALLOW"
This flexibility lets you handle differences like permission dialog labels on Android and iOS. Using testID props on interactive components ensures your selectors stay stable across platforms.
In May 2023, the React Native boilerplate Ignite (v8.7.0) by Infinite Red adopted Maestro as its default end-to-end testing framework. This update included pre-configured Maestro flows like Login.yaml and FavoritePodcast.yaml, making it easier for developers to hit the ground running with UI testing.
"Maestro provides full support for React Native applications on both Android and iOS. By operating at the accessibility layer, Maestro enables cross-platform testing with a single test suite, requiring zero instrumentation or modifications to your JavaScript/TypeScript source code." - Maestro Documentation
For iOS-specific quirks, like touch events being "swallowed" by nested components, you can fix this by setting accessible={false} on the outer container and accessible={true} on the inner target element. This ensures Maestro can interact properly with deeply nested UI elements that display critical data.
Conclusion
Debugging React Native data flow issues involves a clear grasp of its architecture, effective tools, and a thoughtful testing approach. By understanding how data moves through props and state updates, developers can more easily pinpoint and resolve issues. For example, developer Noman Akram shared how, while working on the Bump Connect app in December 2025, the React DevTools Profiler revealed a FlatList re-rendering over 100 times per scroll. The solution? Using React.memo on the PostCard component, which cut renders by 90%.
React Native's debugging tools - like DevTools, Flipper, and Reactotron - offer real-time insights that simplify issue detection. Pairing these tools with a solid testing strategy ensures app stability and performance. A well-balanced testing pyramid, with 70% unit tests, 20% component tests, and 10% end-to-end tests, is a great way to maintain app quality. For end-to-end testing, Maestro stands out. Its YAML-based flows support both Android and iOS without requiring app code changes. Features like automatic waiting and flakiness tolerance make testing smoother and more reliable.
"Testing is the safety net that catches regressions before your users do." - React Native Relay
FAQs
How can I identify the cause of an infinite render loop?
To figure out what's causing an infinite render loop in React Native, start by using React DevTools. This tool lets you examine component hierarchies, props, and state in real time. Pair this with console.log statements in your component's lifecycle methods or rendering logic. By tracking changes to state and props, you can identify the exact update or component responsible for the loop.
What’s the fastest way to find and stop unnecessary re-renders?
The fastest way to pinpoint and prevent unnecessary re-renders in React Native is by using React DevTools. This tool lets you inspect your component hierarchy, props, and state in real time, making it easier to detect re-renders. Another handy approach is to place console.log statements strategically within your components. This helps track data flow and identify when and why re-renders happen. By combining these methods, you can quickly understand and debug your component behavior.
How can I use Maestro to identify end-to-end data flow regressions?
Maestro lets you craft flows that mimic actual app interactions, such as filling out forms, fetching data, and updating the UI. Using its straightforward YAML syntax, you can define actions like launching the app, entering information, and verifying data accuracy. For an even smoother experience, Maestro Studio provides a visual interface to streamline flow creation. Plus, built-in features like automatic retries and waits help manage any delays seamlessly. You can run these flows on a regular schedule or integrate them into your CI/CD pipeline to identify regressions early in the development process.